Workplace Injuries, Accidents, and Fatalities | A State by State Breakdown
July 20, 2020
Worker Safety State by State
As we break down the data on injuries and fatalities across the United States, let’s start with the good news: it’s generally getting safer to be a worker in the U.S.
In almost every state, the number of injuries and deaths in the workplace have trended downward for the last decade. But while we can and should celebrate the progress that has been made, we still have work to do.
Despite the fact that OSHA provides guidelines for employers across the nation, there is a sizable difference between the states when it comes to rates of injury and death for workers on the job.
Through the Bureau of Labor Statistics, we collected data from across the country for the three most recent years available (2016-2018). We then used that information to calculate averages for each state based on numbers of serious injuries, total injuries, and fatalities.
Let’s dig into what we found.
The Last Frontier
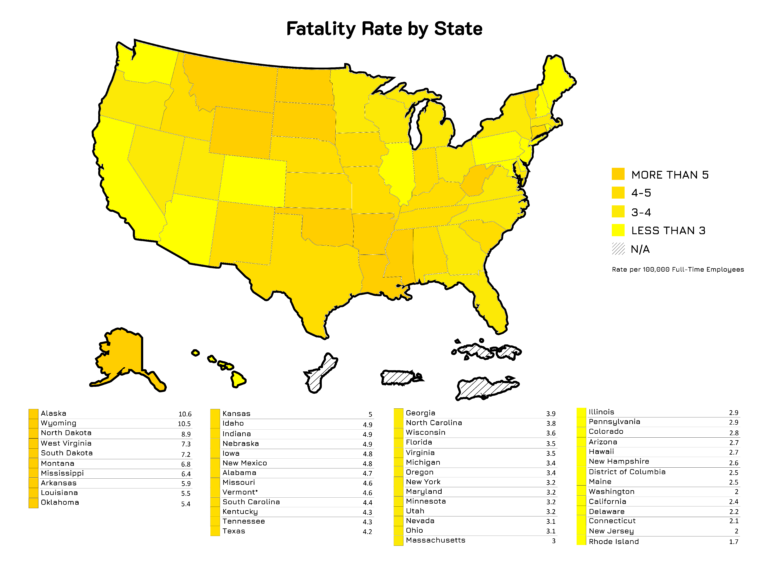
The state with the highest worker fatality rate? Alaska.
Perhaps unsurprisingly, the state known for its massive undeveloped wilderness and harsh conditions carries an average fatality rate of just over 10.5 per 100,000 full-time employees.
What might account for this? Alaska does have a high number of workers in more dangerous service-providing industries such as transportation and manufacturing.
Transportation is dangerous wherever you go, but weather conditions may make it more hazardous in Alaska. Construction is the most dangerous sector in the country, but in the last few years, Alaska has actually seen a decrease in construction jobs, meaning that wouldn’t account for the slight increase in fatalities.
Another possible reason is geography. Towns in Alaska are spread out over vast distances and, by extension, so are hospitals. In the entire state, there is one hospital every 21,183 square miles (2mi). That includes the state’s urban areas where most of the population and health care facilities are concentrated. If you exclude urban areas, Alaska has one hospital per 33,6442mi. For workers injured outside of urban areas, help may just be too far away.
Wyoming is second to Alaska in its worker fatality rate. It’s also the second–least densely populated state. With 37 hospitals, Wyoming has just one every 2,6242mi. The other state in the top three fatality rates, North Dakota, has one hospital every 1,2902mi.
The states with the lowest fatality rates tend to be more densely populated, with more hospitals per square mile. Rhode Island (more on them shortly) has one hospital every 942mi and the nation’s lowest worker fatality rate. The two other states that come out on top of our survey, New Jersey and Connecticut, boast one hospital every 65 and 1792mi, respectively.
We can get a sense of how important this is by comparing worker fatality rates with rates of total and serious injuries. The theory being that if speedy medical intervention means the difference between serious injury and death, one would see states with higher hospital density reporting a large difference between worker injuries and worker deaths.
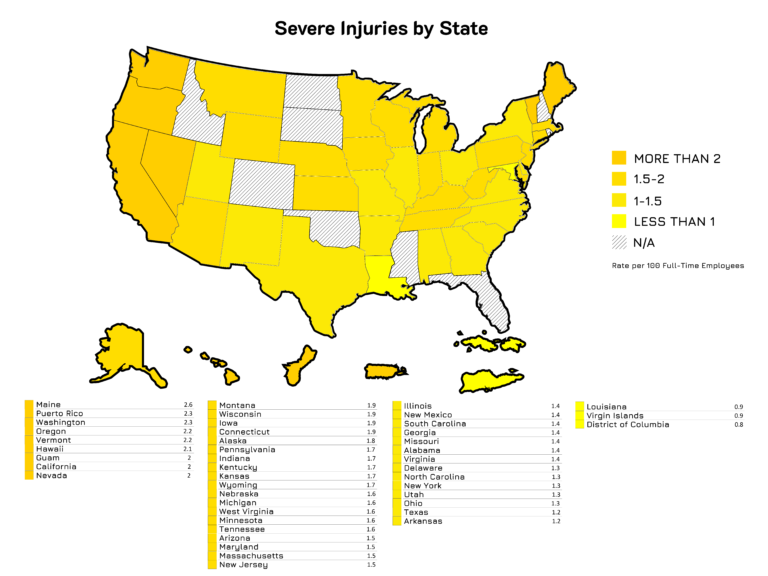
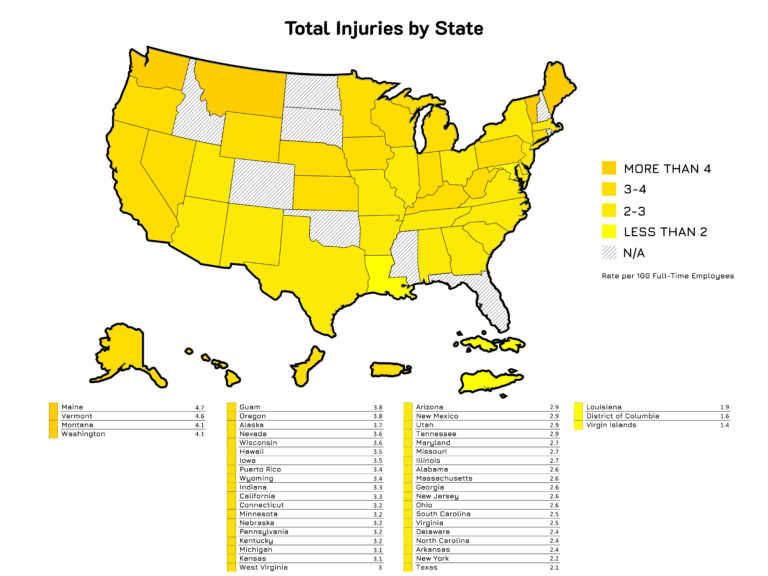
There is some evidence for this, but it’s not overwhelming. Maine has the seventh-lowest worker fatality rate but the highest rate of both total injuries and severe injuries requiring days off or a change in job duties. California has the eighth-highest rate of severe injury, the fifth-lowest death rate, and one hospital every 4772mi.
It’s not possible to assign these differences to a single cause, and a big part of the reason is that the data we have is incomplete.
Nine states, including our home state of Colorado, don’t report data on non-fatal workplace injuries to the Bureau of Labor Statistics. Four of those states—North Dakota, South Dakota, Mississippi, and Oklahoma—are in the top ten for worker fatality rates. New Hampshire and Rhode Island, on the other hand, both rank in the ten lowest fatality rates and don’t report injury statistics. Florida and Idaho are the other states that don’t share this data with the federal government.
Despite this glaring hole in the data, some clear pictures do emerge. While we stress that injuries can happen anywhere, there is a clear difference between the top and bottom of both lists.
The lowest injury rate belongs to Washington, DC, with 1.5 injuries per 100 full-time workers. This contrasts with Maine’s rate of 4.73 at the other end of the scale. The difference in fatality rates is even larger, ranging from 10.56 per 100,000 full-time workers at the top to 1.73 at the bottom.
While we don’t feel it’s responsible to assign a reason for these differences between the states, we wholeheartedly believe that worker safety can and should always be improved. Better procedures, better training, and, yes, better equipment can help ensure these numbers continue to fall.